This function draws a choropleth map of a numeric variable. It includes options to display summary statistics and subtitle. The legend produced is dependent on the dataset; if there are no exclusions, no areas below the minimum aggregation value, and no areas with missing rates, their respective entries will be excluded from the legend.
plotGATmaps(
  area,
  var,
  clr = "Blues",
  title.main = "",
  class = NULL,
  after = FALSE,
  title.sub = NULL,
  breaks = 5,
  colcode = NULL,
  mapstats = FALSE,
  ratemap = FALSE,
  closemap = FALSE
)
Arguments
- area
A spatial polygons data frame.
- var
A numeric variable within the spatial polygons data frame.
- clr
The color scheme to use for the map, from RColorBrewer.
- title.main
The map's main title as a text string.
- class
The cut points for the choropleth categories. Default is NULL, in which case the function calculates breaks from the data using the breaks value.
- after
Boolean denoting whether the function is mapping the aggregated area "after" map.
- title.sub
The map's subtitle (if relevant) as a text string.
- breaks
Number of categories for the choropleth.
- colcode
Color code predefined for before/after maps.
- mapstats
A boolean denoting whether or not to include summary statistics: min, median, and max.
- ratemap
Boolean denoting whether the variable that is to be plotted contains decimal values that require rounding. In GAT, this applies to the GAT-calculated rate.
- closemap
A boolean to denote whether to close the map window after the map is drawn and saved.
Details
The map produced by this function is designed to be saved to a recordPlot object for later rendering in a PDF rather than displayed directly. If plotting directly, the display may be distorted. For best results, save to a recordPlot object and write to PDF.
Examples
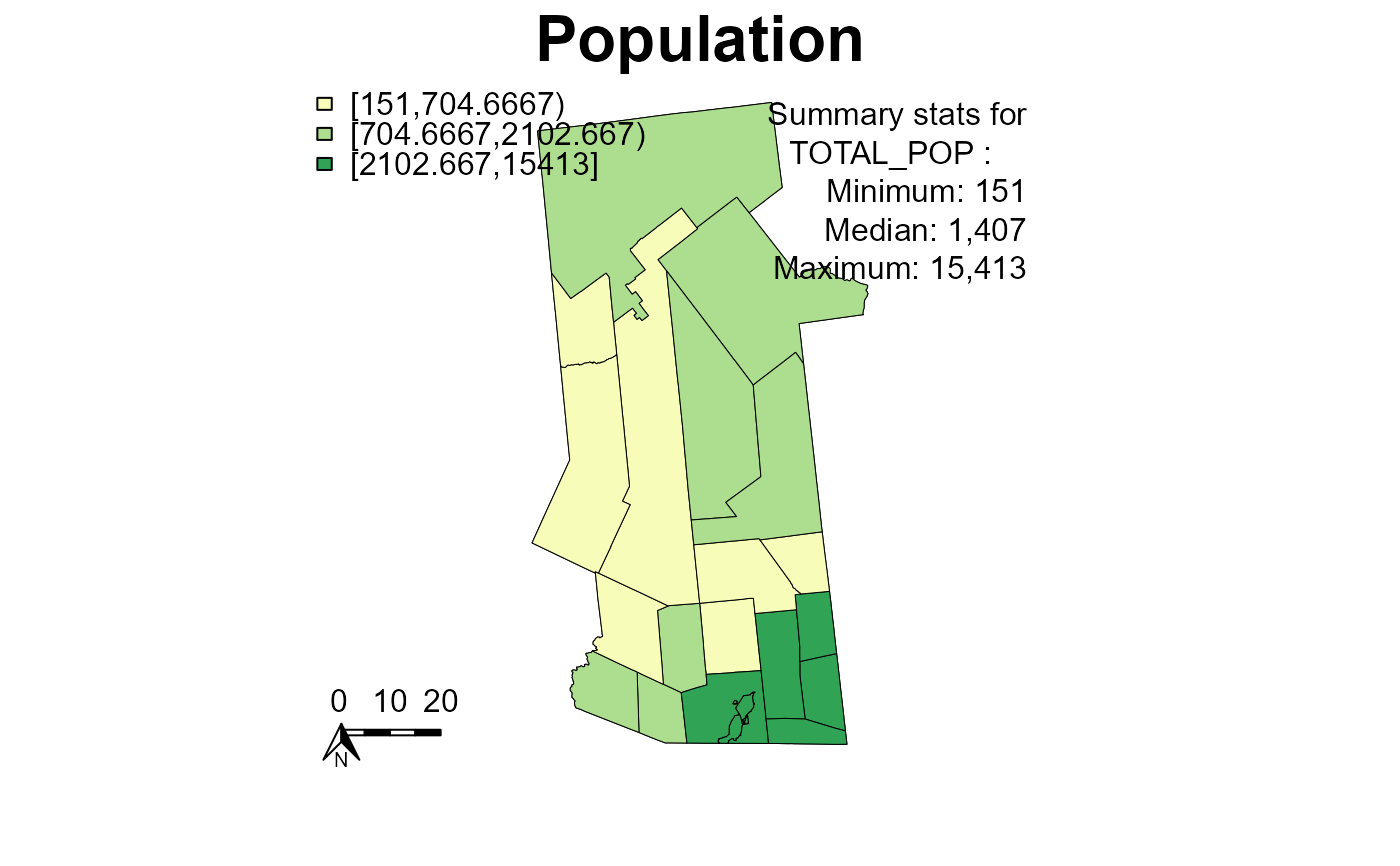
## plot population
# create a flag variable (used to check for and map exceptions)
hftown$GATflag <- 0
# plot the population
plotGATmaps(area = hfcw610k, var = "TOTAL_POP", clr = "YlGn",
title.main = "Population", breaks = 3, mapstats = TRUE)
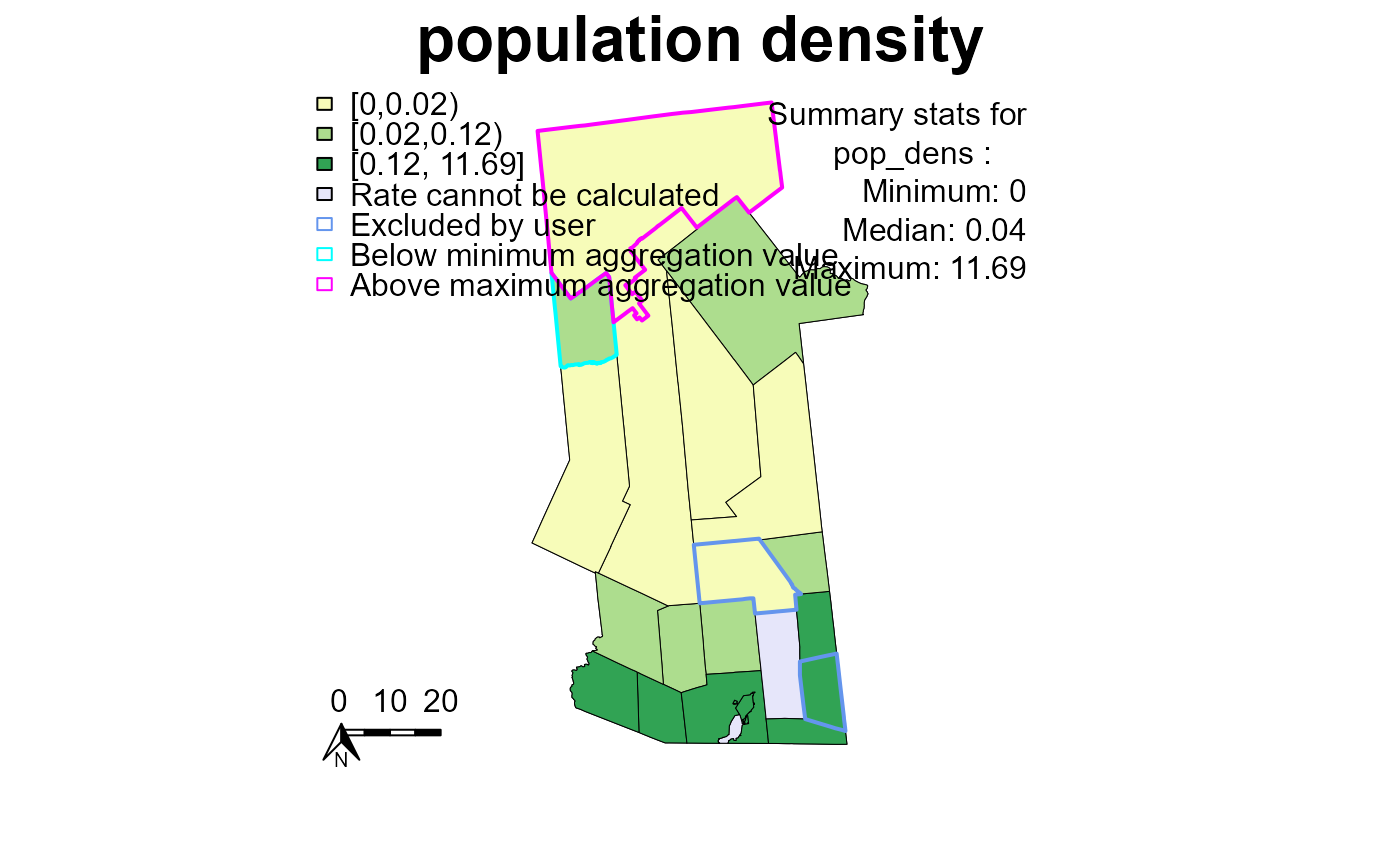
## to plot a rate
# create a randomized flag variable (data will not match labels here)
# 0 = no flag, 1-3 = excluded by user, 5 = above maximum aggregation value,
# 10 = below minimum aggregation value
hftown$GATflag <-
sample(c(0, 1, 5, 10), nrow(hftown), replace = TRUE,
prob = c(.8, .1, .05, .05))
 # create a rate
hftown$pop_dens <- 10000 * hftown$TOTAL_POP / hftown$AREALAND
# add a couple random missings to illustrate uncalculated rates
hftown$pop_dens[sample(length(hftown), 2)] <- NA
# plot the rate
plotGATmaps(area = hftown, var = "pop_dens", clr = "YlGn",
title.main = "population density", breaks = 3,
mapstats = TRUE, ratemap = TRUE)
# create a rate
hftown$pop_dens <- 10000 * hftown$TOTAL_POP / hftown$AREALAND
# add a couple random missings to illustrate uncalculated rates
hftown$pop_dens[sample(length(hftown), 2)] <- NA
# plot the rate
plotGATmaps(area = hftown, var = "pop_dens", clr = "YlGn",
title.main = "population density", breaks = 3,
mapstats = TRUE, ratemap = TRUE)